Conversion rates are foundational for understanding and optimizing a business. Decision-makers may ask, for example:
What’s the click-through rate on our landing page?
What fraction of users sign up for our premium-tier service?
How long does it take users to upgrade to a new version of our product?
What fraction of job candidates accept our offer?
These are deceptively simple questions. They are tricky to answer correctly because successful conversions are delayed by variable lengths of time, and because we often don’t get any explicit signal at all for failed conversions.
In this article, we’ll compare conversion modeling to the common analytics approach, and explore how to decide between the two. Throughout, we’ll use a hypothetical example where we want to know the rate at which new users sign up for our premium-tier service.
TL;DR
A common approach to computing conversion rates is to pick a fixed-length observation window. Quick and easy, do-able entirely in SQL, but crude.
Conversion models describe both the conversion rate and how long it takes for conversions to happen. They are more powerful than the fixed-window method but require some investment to learn, implement, and communicate.
For a given task, if you can choose an observation window length that captures almost all conversions with high certainty and is short enough to serve as useful feedback for business decisions, go with the fixed-window method. If not, or you want to optimize time-to-conversion instead of the final rate, go with a conversion model.
The quick-and-dirty approach
Take our example of new users signing up for a premium-tier service. To be concrete, let’s say today is March 10th. To keep it simple, suppose we get one new user per day. Our data look like the following plot, where each user is represented by a row. The circles show when new users arrive, stars indicate conversions, and hour-glasses indicate the users who have not (yet) converted.
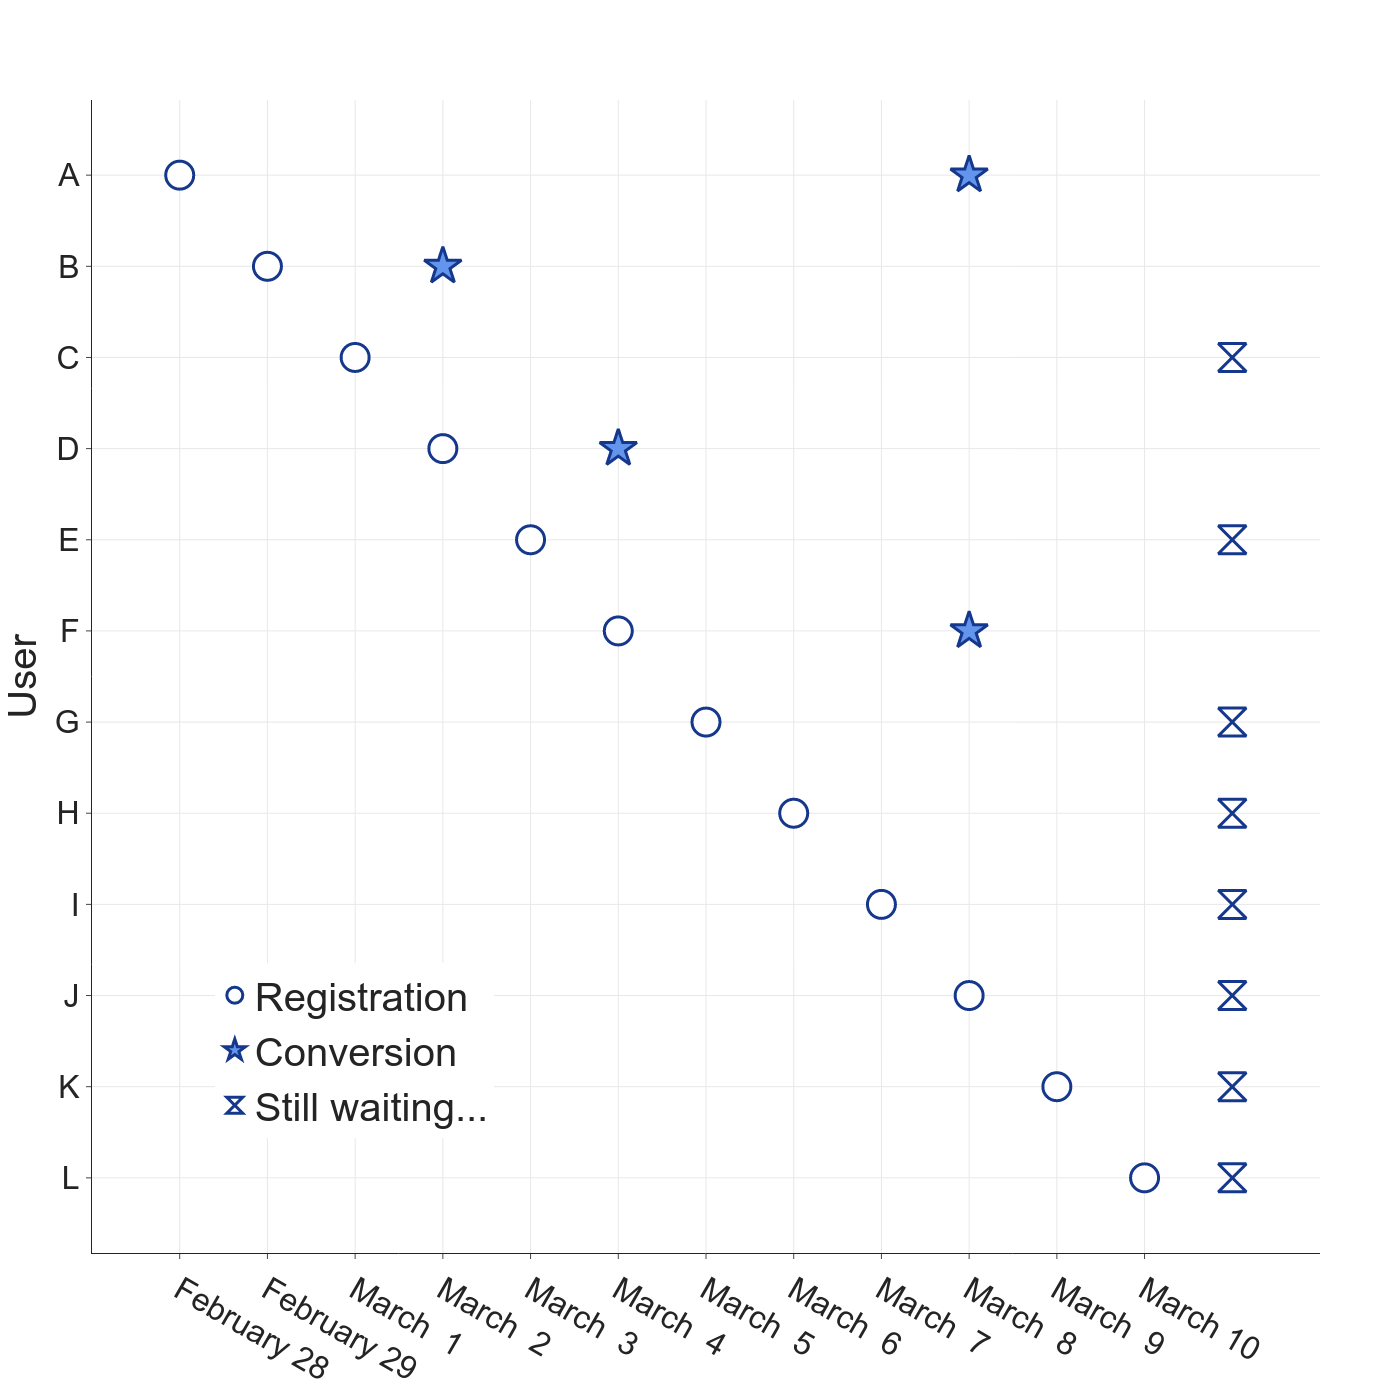
Four users have converted so far, but it took each of them a few days to think about it. We have no signal from the other either users.
The naïve conversion rate computation is simply the number of converted users divided by the total number of users (4/12 = 33% in our toy example). This approach is not a good idea; users who arrived more recently haven’t had enough time to make up their minds yet.
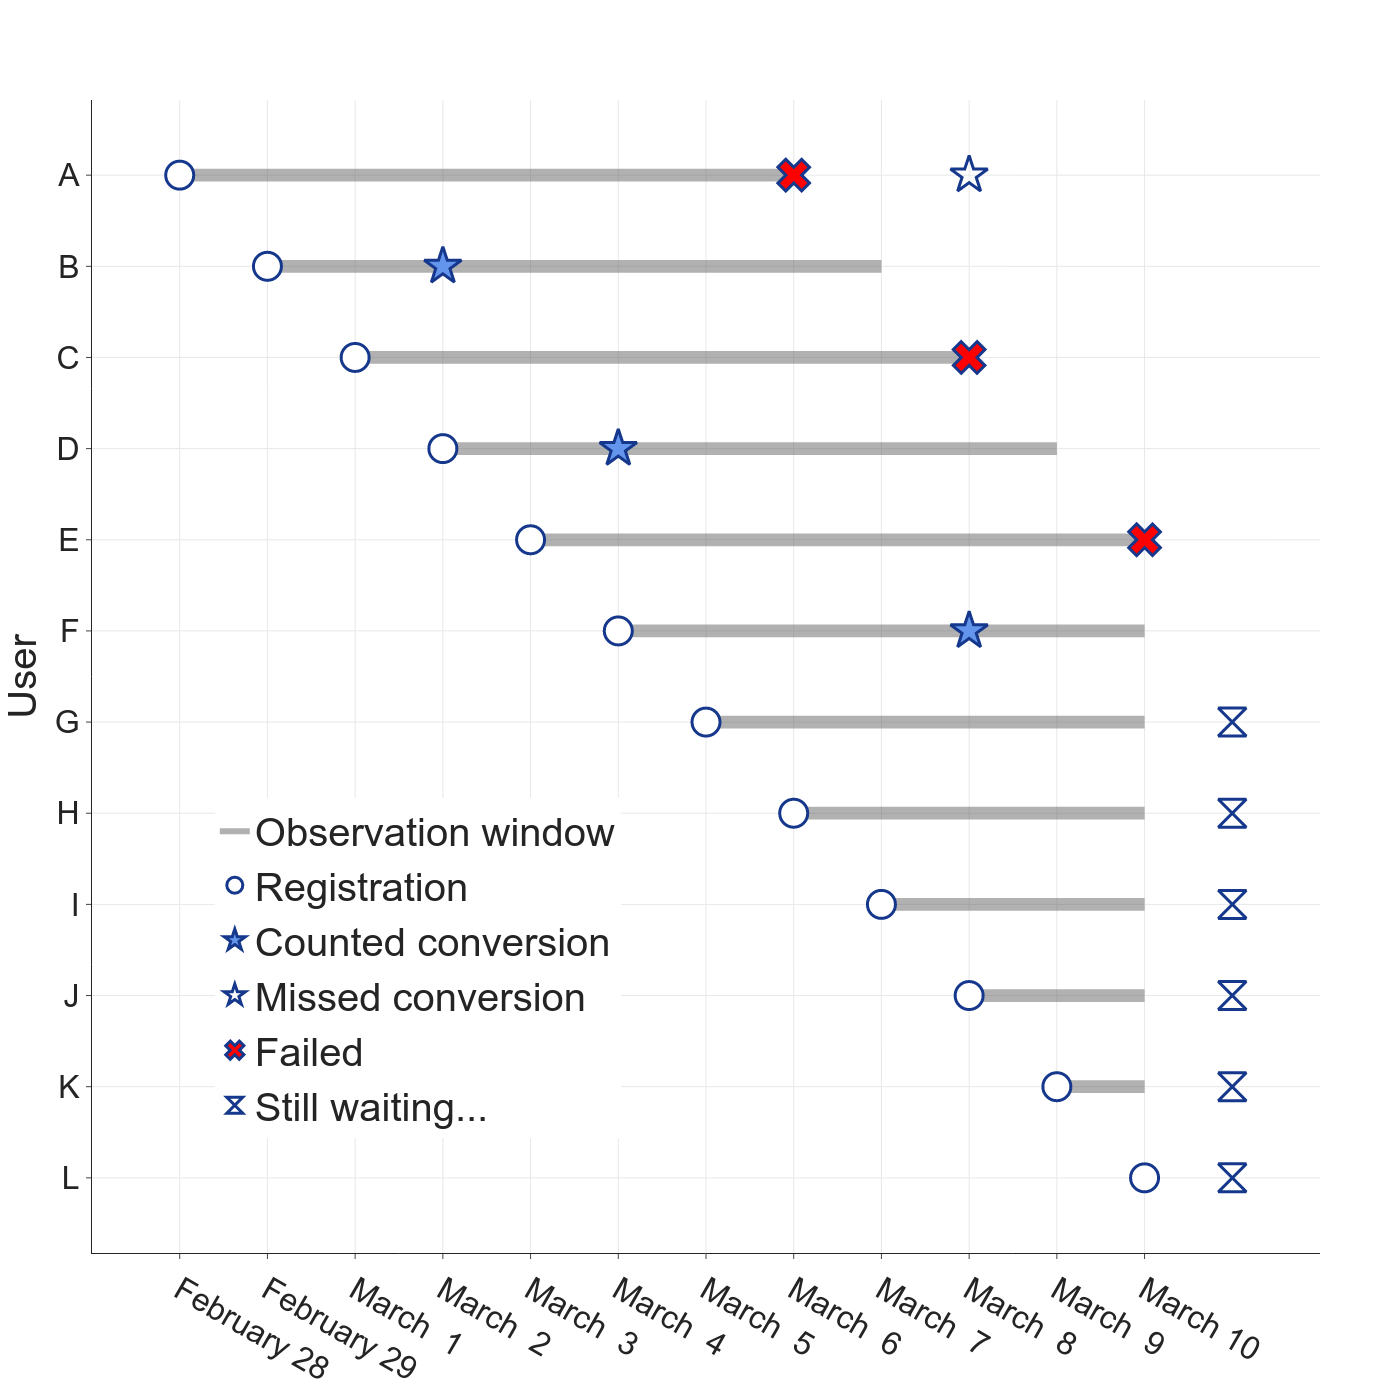
A better way—especially when comparing conversion rates across segments, cohorts, or experiment variations—is to use fixed-length observation windows. In our demo scenario, we might choose a 7-day window, for example. The clock for a user (or session, job offer, etc) starts as soon as they arrive.
If the user converts within the window, we count a success. In our running example, users B, D, and F fall into this category.
If the user doesn’t convert during the observation window, we count a failure. Even if we know they convert later, we still count a failure. Users A, C, and E are in this category (user A did convert, but after the window closed).
If the user’s observation window is still open, we ignore them entirely.
The conversion rate is the number of successful conversions divided by successes plus failures. With this method, our example conversion rate would be 3/6 = 50%, quite a bit different from the naïve result.
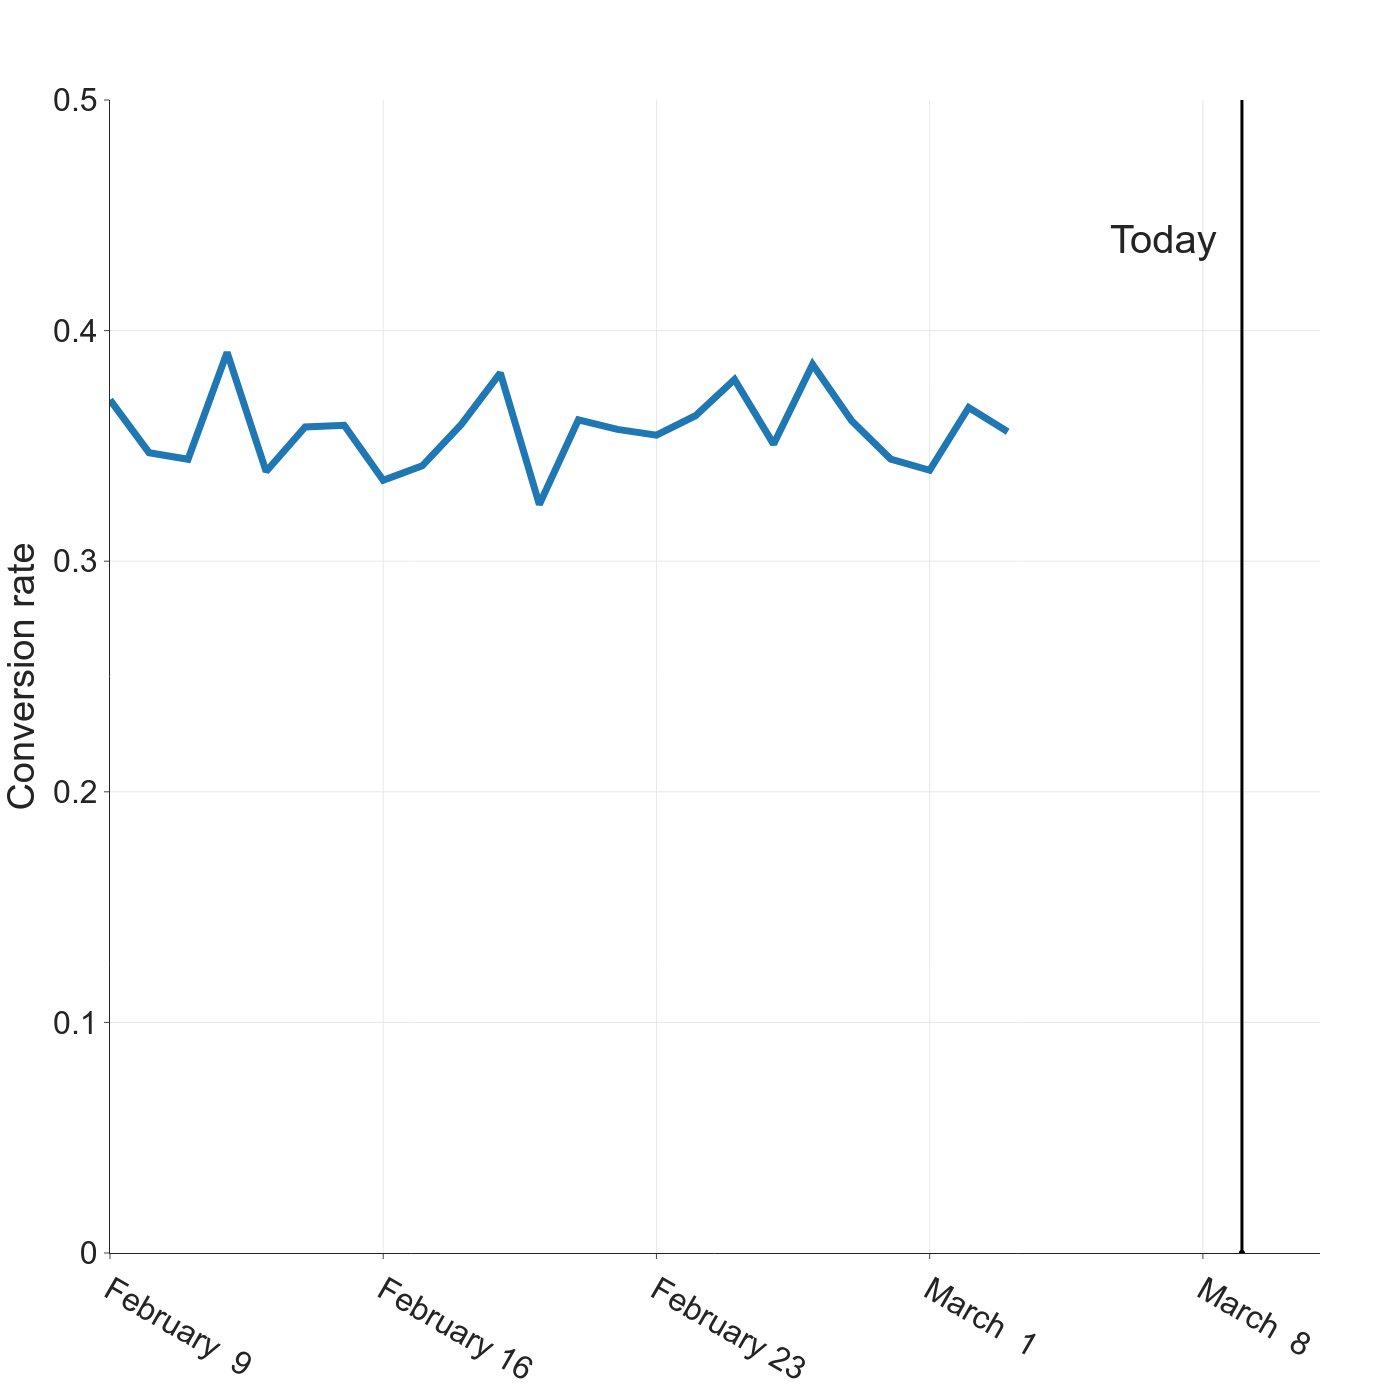
To track this metric over time, we group users into time-based cohorts and compute the conversion rate for each cohort that has a full observation window. Cohorts still under observation should not be reported. If we use daily cohorts for our example (and assume now that we have many new users per day), our tracking plot would look like this:
A powerful alternative
Our hypothetical example shows how the standard approach can fail: user A converted after the observation window ended, so they were counted as a failure. We could lengthen the observation period to avoid this, but the longer the window, the longer we have to wait to observe the metric and the slower our decision-making cadence gets.
Conversion models avoid this delicate balance by modeling time-to-conversion as best as we know it so far, instead of binary conversion status. In our scenario, for example, we don’t know if or when user E will convert, but we do know their time-to-conversion is at least 8 days. In tabular form, this looks like
| user id | minimum time to convert (days) | has converted |
|---|---|---|
| A | 10 | true |
| B | 3 | true |
| C | 10 | false |
| D | 3 | true |
| E | 8 | false |
Conversion models adjust statistically for the cases when conversion hasn’t happened yet (known as censored data). The canonical model output is a plot that shows the estimated conversion rate as time passes from the moment conversion becomes possible, e.g. a new user arrives.
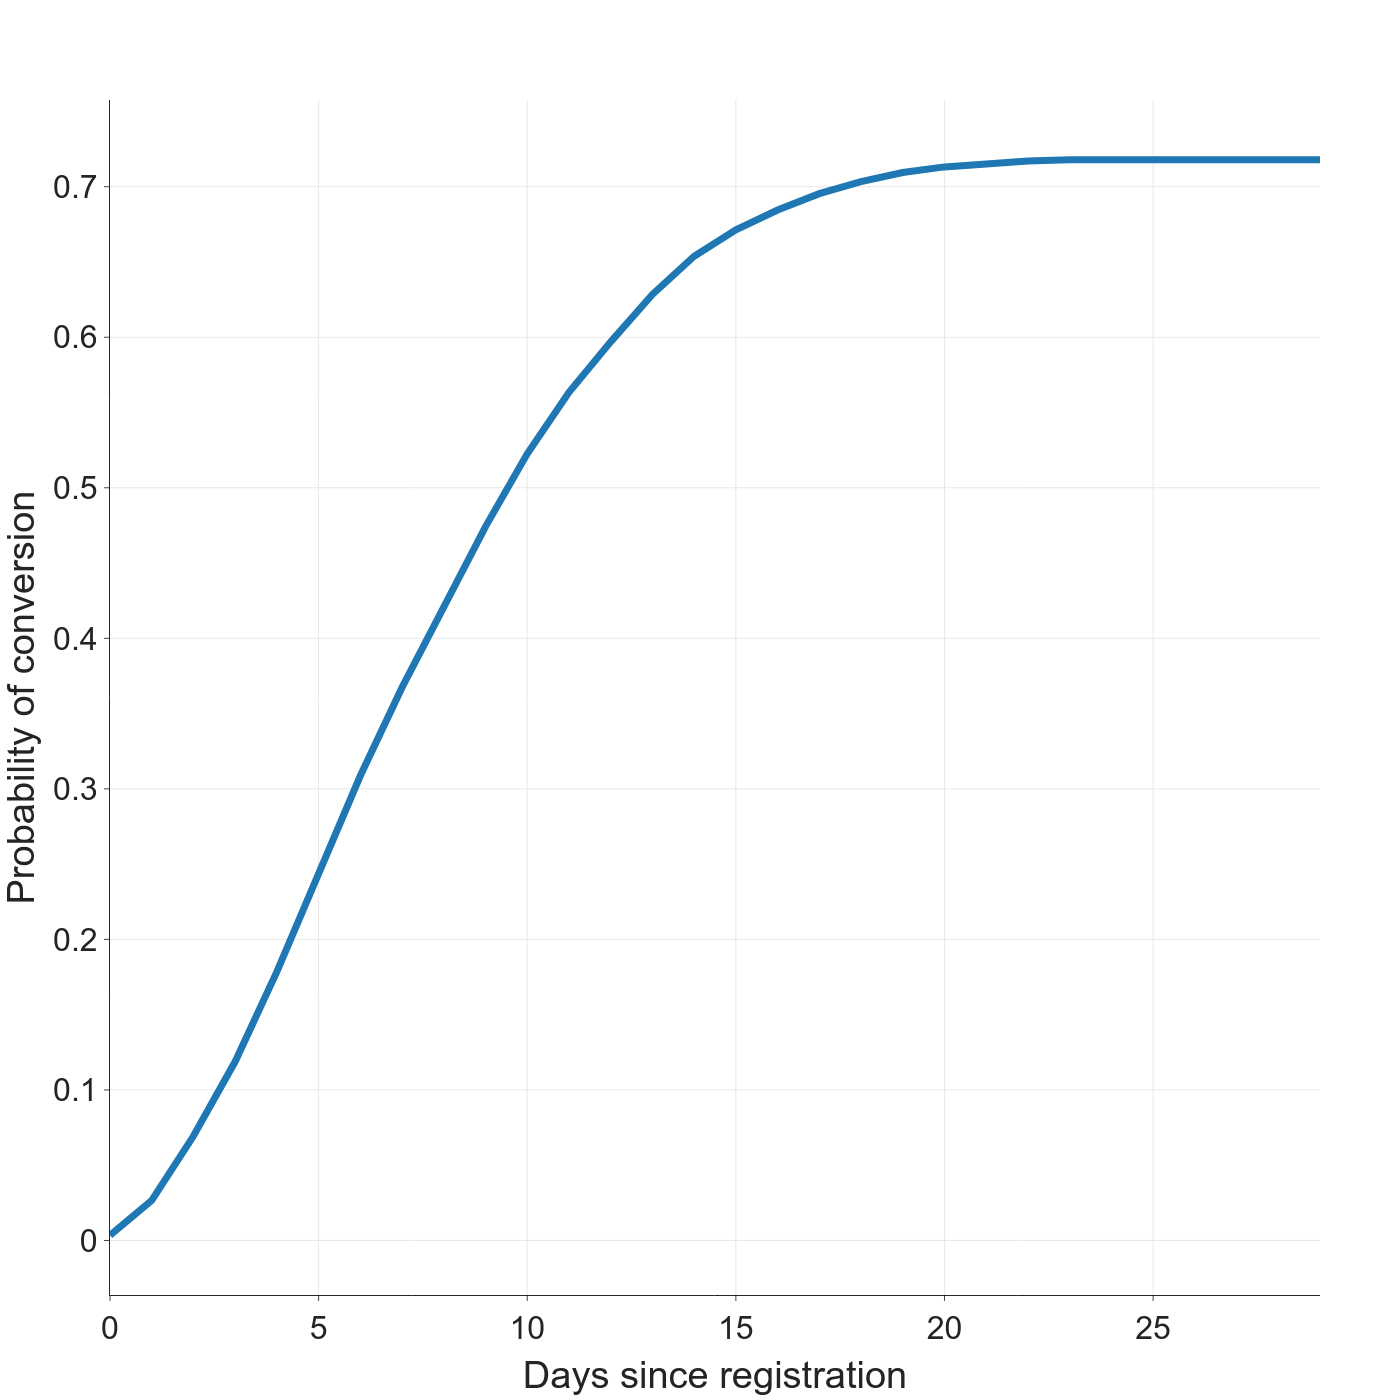
The conversion curve for our running example shows that about 35% of new users convert within 7 days, but 72% of users convert if we just wait another couple weeks. Our fixed-window approach was very misleading because we chose a bad window length.
For more on how conversion models work, we highly recommend Erik Bernhardsson’s posts on the topic (first, second), as well as his Convoys Python package. Conversion models are closely related to survival analysis, which has an extensive literature. Two introductory sources we like are the Lifelines Python Package and Keith McNulty’s book Handbook of Regression Modeling in People Analytics. We will dig into conversion model interpretation and decision-making in a future article.
Which approach should I use?
If you can find a good observation window, use the fixed-window method
The fixed-window approach is simpler and faster than conversion modeling. It can be done entirely in SQL without leaving your data warehouse or BI platform, requires no explanation for business operators, and you don’t have to spend any time up-front learning new models and software packages.
To use the fixed-window approach, however, you must be able to pick an observation window that
- is long enough to catch almost all conversions with high certainty, and
- is short enough to serve as useful feedback for product and business decisions.
Estimating click-through rates on a landing page, for example, is a great candidate for the fixed-window approach because a window of 12 or 24 hours is likely long enough to capture almost all click-throughs but still short enough that the output metric can serve as feedback for optimization. The job offer acceptance example would also work well with a fixed-window approach; the observation window would have to be several weeks long, but the optimization cadence for this use case is typically even slower.
If you can’t pick an observation window that balances these criteria, then you should switch to conversion modeling. Premium-tier sign-up rate is a good example of this: conversions may be delayed for weeks or even months, which is far too long for most businesses to wait for feedback on mission-critical product changes.
Pro tip: even if you prefer a fixed-window approach, fitting a conversion model is a great way to check whether the fixed-window approach is feasible and to choose the length of the observation window.
If time-to-conversion matters, use a conversion model
Maximizing the conversion rate is not the only way for a business to optimize; we can also reduce the time-to-conversion. In cases with high conversion rates, this may be the only optimization avenue left. If reducing conversion time matters, you should invest in conversion modeling.
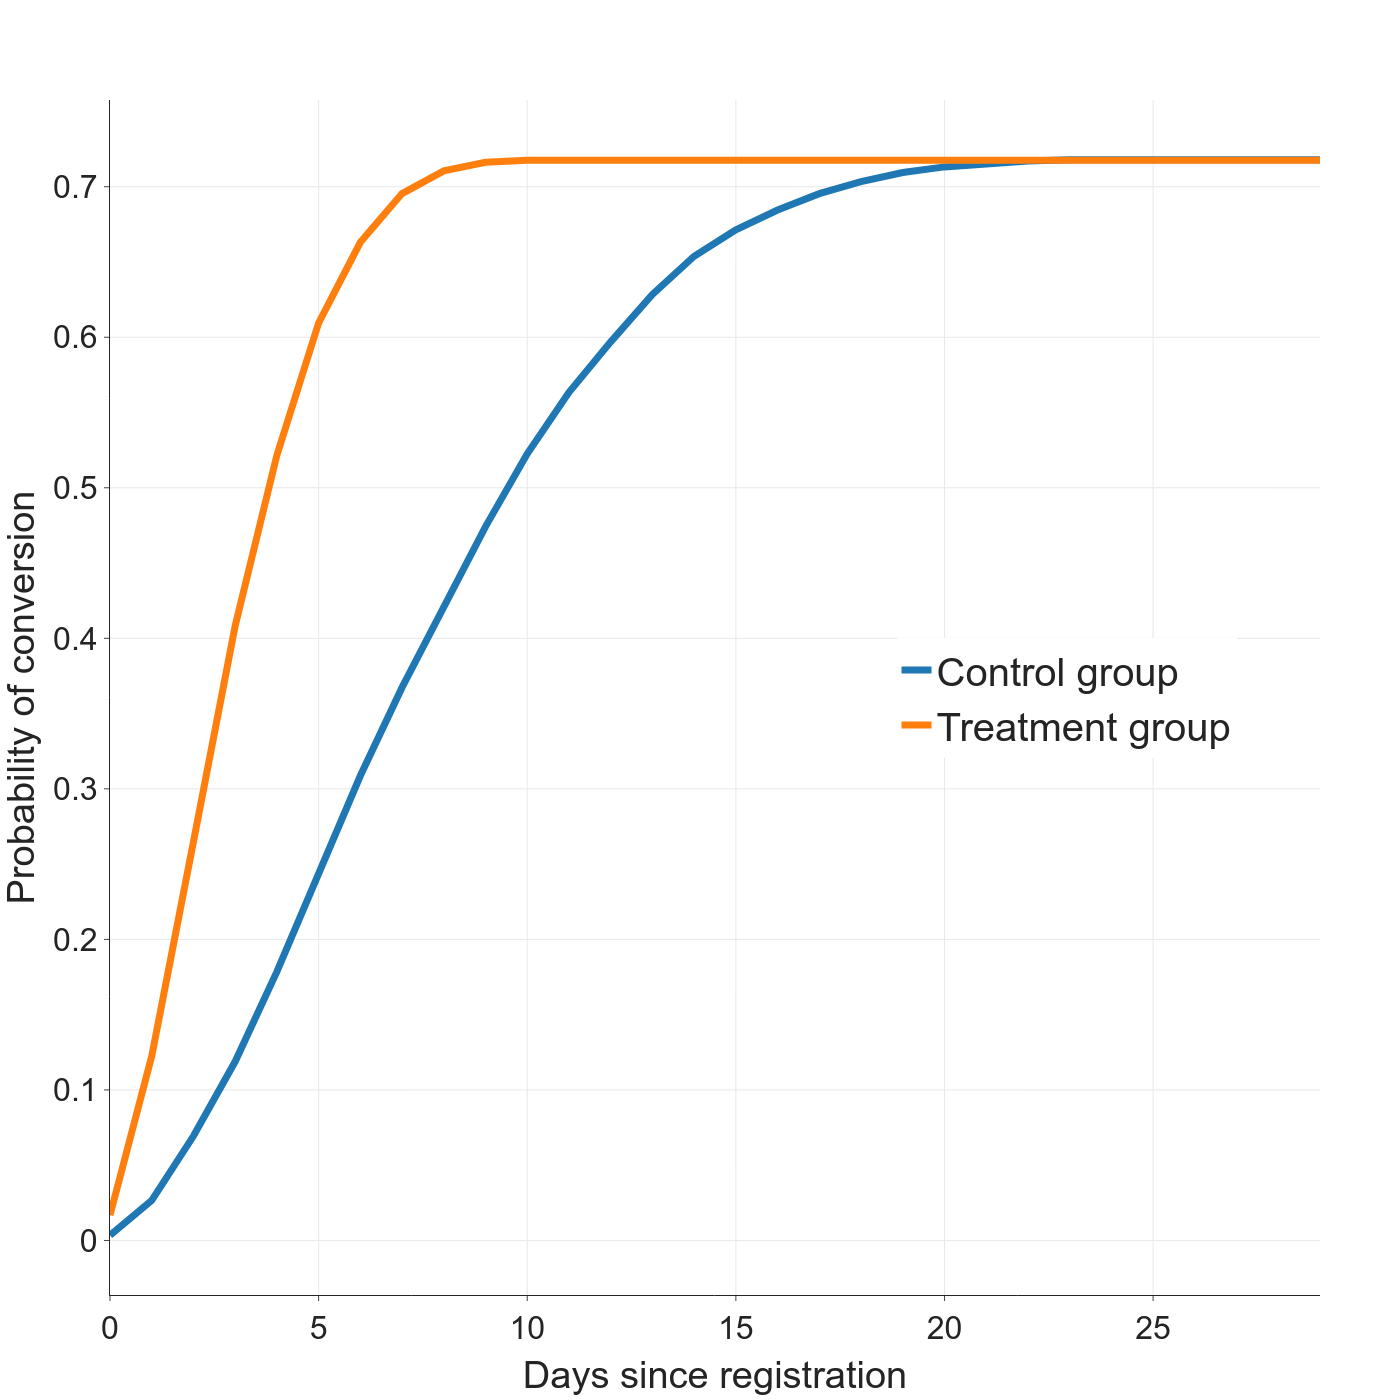
The canonical model output shows both the final asymptotic conversion rate and the distribution of time-to-conversion. Suppose we A/B tested a new email marketing campaign to persuade new users to sign up for our hypothetical premium service. The blue curve below describes the control group and the orange describes the treatment group. The final conversion rate is the same for both groups (72%), but the treatment group converted much more quickly. (60% conversion at 5 days for treatment vs. 12 days for control).
In this scenario, the fixed-window approach would either incorrectly show different conversion rates (with a short window), or miss the time-to-conversion impact altogether (with a long window).
A good example where time-to-conversion is more important than conversion rate is new product rollout and adoption. In this use case, there isn’t any observation window that makes sense; the adoption rate rises steadily until the whole user base is on the new product version (or an even newer version comes out). Conversion modeling is a much more natural fit for this scenario.
Other things to consider
Both conversion rate approaches we’ve discussed apply only to situations with binary outcomes (e.g. click-through or not, premium sign-up or not, etc). If your task has more than two possible outcomes, you’ll either need to collapse the outcomes into two categories or use a different method.
Don’t confuse fixed-length observation windows with calendar-based observation windows, where the observation period starts on the same date and ends on the same date for all users, regardless of when they arrived. Unless the group enrollment window is very short relative to the observation window, late arrivals will have less time to convert than early arrivals—the original problem we wanted to avoid.
What next?
We now have a better sense of when conversion modeling is worth the investment vs. the quick-and-dirty fixed-window approach. Check out Erik Bernhardsson’s blog posts (here and here) for more on the nuts and bolts of conversion modeling. In our next installment, we will take a closer look at how to interpret conversion models and conversion curves and how to make business decisions based on them.