Few topics receive more attention from company execs than the customer journey, a metaphor for how a user’s interactions with our product change over time.1 Modeling customer behavior can be one of the best ways for industry data scientists to deliver value, but our off-the-shelf methods often don’t match the way decision-makers think about the problem. This mismatch leaves valuable data underutilized and leads companies to make counterproductive decisions.
We can do better! Join us as we explore how.
Customer journey breakdown
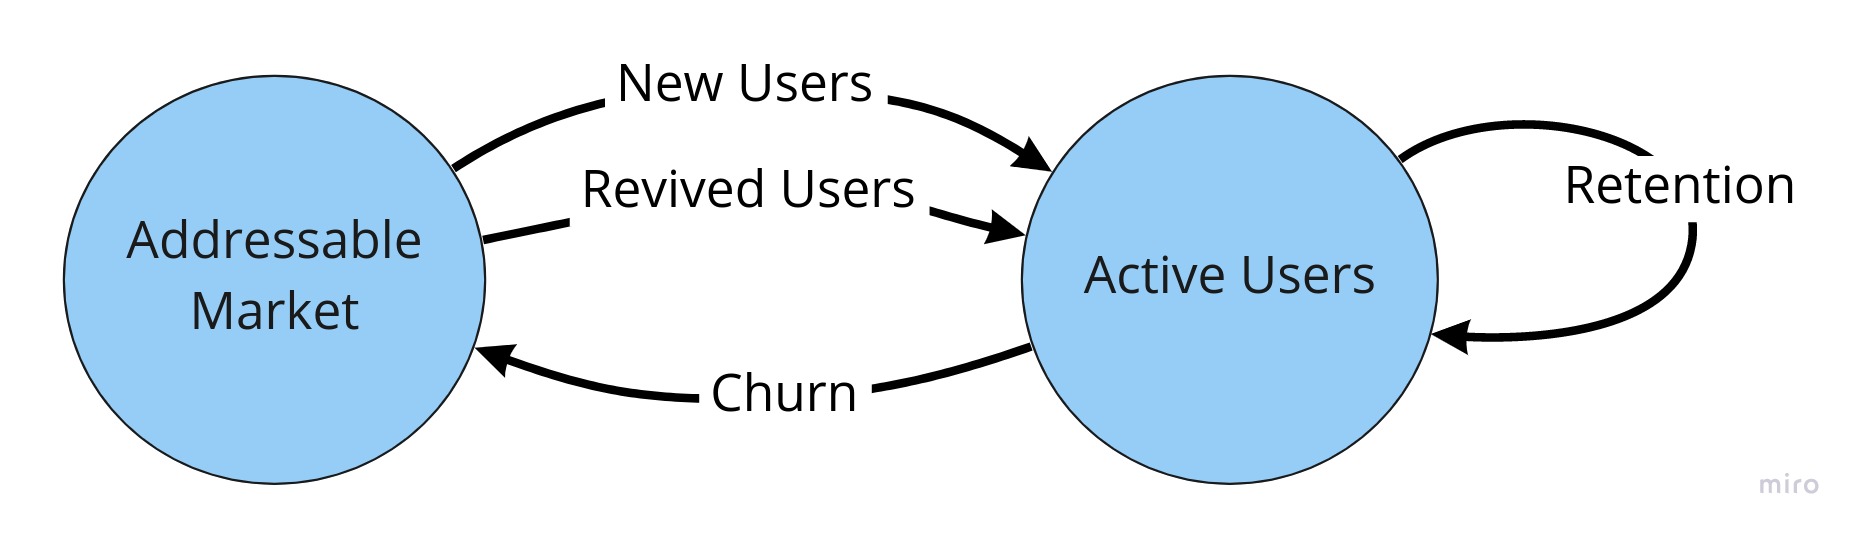
Product and growth teams often implicitly think about the customer journey as a state space. The states aren’t super interesting–users are either active or not–but the various transitions are watched and analyzed closely.
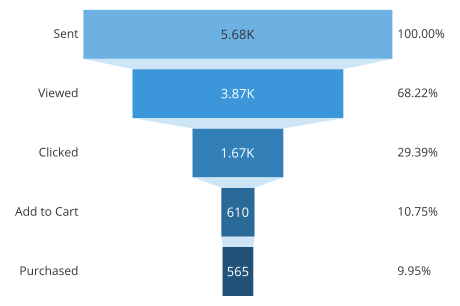
New user conversion is the transition from non-active to active user. Analysts often use a funnel plot to show the fraction of new (or revived) users that make it to each successive step on the path to being a happy, paying customer.2 The image below is an example from Chart.io that shows an conversion funnel for an email marketing campaign. Of the 5,680 users who were sent the email, 3,870 (68.22%) viewed the message, 1,670 (29.39%) clicked the message, and so on.
Customer retention questions revolve around how sticky a product is (e.g. Daily Active Users / Monthly Active Users), how engaged users are with a product, and how this compares to users’ engagement with competitors. For subscription-based revenue models, churn prevention gets at the complement: which customers are dis-engaging with our product? Churn prevention tends to be more action-oriented, i.e. which customers to target for an intervention and how best to persuade them from leaving.
Customer lifetime value (LTV) seeks to understand how much revenue each customer generates over the life of their account, and to find actionable patterns in that number across customer segments or time. This information provides constraints to other business decisions like marketing budget allocation. This is one aspect of the customer journey that is better represented as a state rather than a transition.
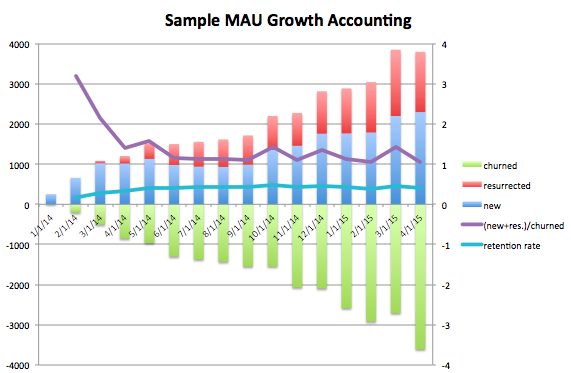
Growth accounting tallies the various customer state transitions to track the overall active user base over time. In a given time period the active user base is the sum of retained, new, and revived users minus churned users (which may be unobserved for products not on a subscription model).
Final thoughts
Before starting an analysis of your customer journey, think about answering these questions:
How do product managers and company leaders think about this part of the customer journey? What kinds of questions do they ask? What mental models and metaphors do they use?
What methods do data scientists typically use to answer these questions?
In what situations and ways do standard data science methods fall short of business needs? How to detect and diagnose these shortcomings?
How can data scientists better answer business requests?
Most data science training programs don’t address these kinds of practical issues, but they are essential for success in applied data science.